A good ROAS in 2026 is any return that clears your break-even point with room to spare. Most advertisers use 4:1 — four dollars of revenue per dollar of ad spend — as a rule of thumb, but the honest answer depends on your gross margin: break-even ROAS equals 1 divided by gross margin.
That single formula is why a "good ROAS" for a software company would bankrupt a furniture brand. Before you judge any campaign, you need two numbers: your actual ROAS and the minimum ROAS your margins can survive. Both take about thirty seconds to calculate.
How Do You Calculate ROAS?
ROAS (return on ad spend) is revenue attributed to your ads divided by what you spent on those ads. If you spent $2,000 on Meta ads last month and those ads drove $8,000 in tracked revenue, your ROAS is $8,000 ÷ $2,000 = 4.0, usually written as 4:1 or 400%.
Two things trip people up. First, ROAS uses revenue, not profit — a 4:1 ROAS does not mean you made 4× your money. Second, attribution windows vary by platform, so compare campaigns inside the same platform before comparing across platforms.
The free ROAS calculator handles the formula — plus the break-even math below — in one place.
Is 4:1 Actually a Good ROAS?
The 4:1 benchmark survives because it works for a typical mid-margin ecommerce business: enough return to cover product costs, shipping, overhead, and still bank profit. But it's a rule of thumb, not a law. "Good" is entirely relative to what you keep from each sale.
Think of it this way:
- High-margin products (digital goods, supplements, jewelry) can be comfortably profitable at 2:1 or even lower.
- Mid-margin products (apparel, home goods) usually need the classic 3:1 to 4:1 range.
- Low-margin products (electronics, groceries, resale) may need 5:1 or more just to stay above water.
A brand celebrating a 3.5:1 ROAS on a 20% margin product is quietly losing money on every order. A brand sweating over a 2.2:1 ROAS on an 80% margin product is doing fine. The benchmark that matters is yours.
What Is Your Break-Even ROAS?
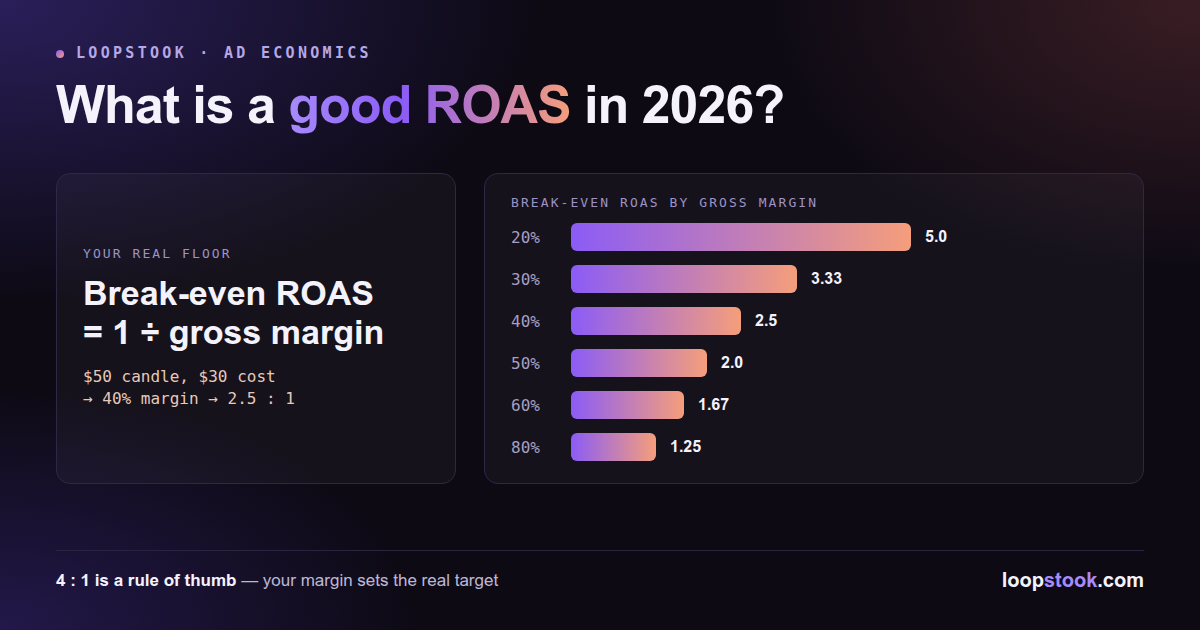
Break-even ROAS is the return at which an ad dollar earns back exactly its cost in gross profit — no gain, no loss. The formula: break-even ROAS = 1 ÷ gross margin. At a 40% gross margin, that's 1 ÷ 0.40 = 2.5. Anything above 2.5:1 is profit; anything below is a loss.
Walk through the arithmetic once and it sticks. Say you sell a $50 candle that costs you $30 in product, packaging, and fulfillment. Gross profit is $20, so gross margin is $20 ÷ $50 = 40%. Every $1 of revenue carries $0.40 of gross profit — so you need $2.50 of revenue to recover $1 of ad spend. That's your 2.5:1 floor.
Here's the full table, computed straight from the formula:
| Gross margin |
Break-even ROAS (1 ÷ margin) |
| 20% |
5.0 |
| 30% |
3.33 |
| 40% |
2.5 |
| 50% |
2.0 |
| 60% |
1.67 |
| 70% |
1.43 |
| 80% |
1.25 |
To set a target rather than a survival floor, aim comfortably above break-even — attribution is never perfect, and returns, discounts, and payment fees all eat into the topline number.
Why Do Low-Margin Businesses Need a Higher ROAS?
Because thin margins leave almost nothing per sale to pay for the click that caused it. At a 20% margin, a $100 order yields $20 of gross profit — so $20 is the absolute most you can spend to acquire that order before losing money. At an 80% margin, the same $100 order gives you $80 of headroom.
It's the table's math viewed from the other side: 1 ÷ 0.20 = 5.0 versus 1 ÷ 0.80 = 1.25 — four times the required efficiency in the same auction, against high-margin bidders who can afford to pay more per customer. The realistic paths out: raise average order value (bundles, upsells), improve margin, or get dramatically better at creative — which brings us to the levers.
Which Levers Actually Move ROAS?
On paid social in 2026, creative is the biggest lever you control. Platform algorithms handle targeting and bidding largely on their own, so the variables left to you, roughly in order of impact:
- Creative testing volume. Winners are found, not designed. Teams that test many distinct concepts per week consistently out-iterate teams that polish one "perfect" ad a month.
- Hook quality. The first one to three seconds decide whether anyone watches at all; a stronger hook lifts every downstream metric. If yours feel stale, run your product through the free ad hook generator and test angles you'd never have written.
- Offer. A compelling offer (bundle, guarantee, free shipping threshold) often outperforms months of creative iteration on a weak one.
- Landing page. ROAS is measured on purchases, not clicks. Slow pages, weak product pages, and clunky checkout silently cap the return of even great ads.
Budget and bid tweaks are, by comparison, rounding errors. Fix creative and offer first.
How Does Cheap AI Creative Testing Change the Economics?
It collapses the cost of the highest-leverage lever. Testing ten concepts used to mean ten shoots; with AI image-to-video, a 5-second product clip costs roughly $0.58 on Kling 3.0 through LoopStook, so ten distinct concepts cost less than a coffee — the constraint shifts from production budget to testing discipline.
That changes the low-margin problem too. If your break-even ROAS is 5:1, you can't outbid competitors — but you can out-test them, because a creative that converts twice as well effectively halves your acquisition cost. The full playbook is covered in AI ads for ecommerce, and LoopStook plans start at $14/month — see pricing.
Run Your Own Numbers
Stop guessing whether your campaigns are actually profitable. Plug your revenue, spend, and margin into the free ROAS calculator, find your break-even line, then start out-testing your competitors with AI creative. Start free at loopstook.com — no card required.